
Guide
Solar PV Yield Calculation
A PV yield calculation turns a location, a roof and a panel rating into a single number: kilowatt-hours per year. The formula fits on one line. Almost all of the difficulty sits in the assumptions feeding it.
In short: annual PV yield is roughly irradiance x array size x performance ratio. The irradiance depends on where the array is and how it is tilted, the array size is simply the panels' peak rating in kWp, and the performance ratio absorbs temperature, wiring, inverter and shading losses. On an open field that ratio sits near 0.8; on a roof ringed by parapets and chimneys it is often much lower.
Yield and power are not the same number
A 5 kWp array is rated at 5 kilowatts - but only under standard test conditions: 1,000 W/m2 of irradiance and a cell temperature of 25 °C. In the field it meets those conditions rarely. What you actually buy is energy, and energy is power accumulated over time, so the number that matters is kilowatt-hours per year.
Two shorthand terms show up constantly in quotes and are worth separating:
- Peak power (kWp) - the size of the array, set by the modules.
- Specific yield (kWh/kWp) - production per kilowatt installed, which is a property of the site and the design, not of the panels.
Specific yield is the fairer way to compare two proposals, because it strips out size. A 10 kWp system producing 11,000 kWh a year and a 5 kWp system producing 5,800 kWh have similar specific yields (1,100 and 1,160), and that says more about the design quality than the raw output does.
The formula, and what each term hides
The arithmetic is a single multiplication:
E = H x P x PR
- E - annual energy yield, kWh per year.
- H - annual irradiance received by the array plane, kWh/m2.
- P - array peak rating, kWp.
- PR - performance ratio, the fraction of the theoretical output that survives contact with reality.
P is the easy term - it is on the datasheet. H and PR are where the argument happens.
A worked example: a 1 kWp array at a site with 1,600 kWh/m2 of plane-of-array irradiance and a performance ratio of 0.80 yields 1 x 1,600 x 0.80 = 1,280 kWh over the year. That is a specific yield of 1,280 kWh/kWp, which is realistic for a well-oriented, fixed-tilt roof in a sunny temperate climate.
That example is also the whole point: change the PR from 0.80 to 0.60 and the same array quietly "loses" 320 kWh with nothing else altered. A yield study is, for the most part, a study of losses.
Where the irradiance number comes from
H is not measured on your roof. It comes from a climate dataset - typical meteorological year files, or irradiance derived from satellite imagery - which usually provides a horizontal value, often split into direct and diffuse components. To get the figure in the plane of the array, that data is transposed for your tilt and azimuth.
Two caveats matter more than the choice of dataset:
- Climate datasets assume a clear horizon. They know the sun's path but nothing about the building next door, the parapet, or the tree that will grow. On a constrained urban site the database value is an optimistic ceiling, not an estimate.
- Diffuse irradiance is a large share of the total in cloudy or high-latitude locations. Transposition models are only approximate there, so treat fine differences between datasets with suspicion.
Shading: where estimates quietly fall apart
A single "shade percentage" is the most common - and most misleading - way to describe PV losses. Real modules are wired as series strings with bypass diodes, and the response to partial shading is not proportional:
- Shade the wrong part of one module and it can knock out a whole string segment, not just the covered fraction of area.
- Shade that moves - a chimney through the morning, a neighbouring building in midwinter - hits different strings at different hours, so an annual average hides the damage rather than showing it.
- Arrays shade themselves: at low winter sun, the front row throws its shadow onto the row behind.
This is why a single slider labelled "shade factor" is close to useless, and why the honest approach is a time-stepped simulation: compute the sun position for each hour of the year, project it through the actual scene geometry, and accumulate what each surface really receives. That is shadow modeling applied to an energy problem, and it also produces the kind of architectural shadow analysis a designer may already need - here, shaded hours count as lost kWh.
Tilt and azimuth: don't chase the optimum
People agonise over the exact "best" tilt, but the payoff curve is flat near the top.
- Within roughly 10° of the local optimum, tilt costs only a few percent.
- Azimuth is more forgiving than intuition suggests for fixed arrays; a 20° swing away from due south (due north in the southern hemisphere) is typically a low single-digit loss.
- What is not forgiving is an azimuth aimed at a permanent obstruction, or a tilt chosen for looks that leaves the array lying in a parapet shadow for half the day.
In short, spend the effort on the shade survey and on the plane that receives 1,600 kWh/m2, not on the last 2% of tilt.
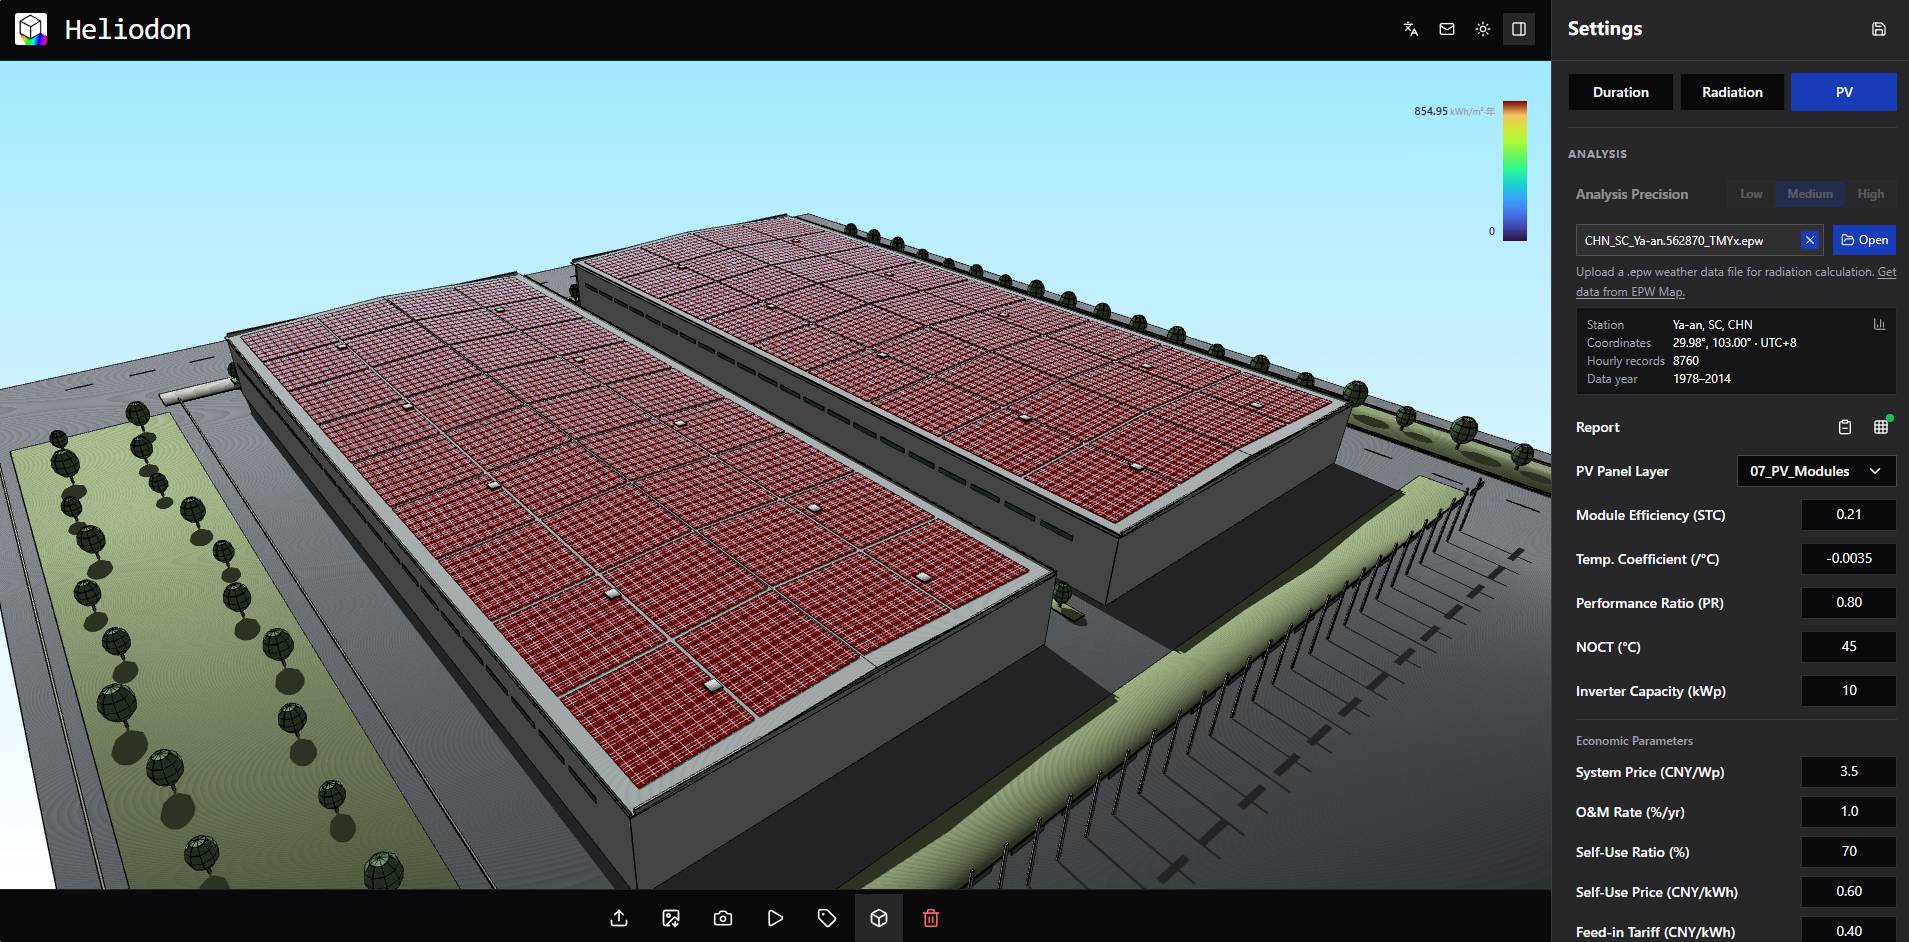
Calculating PV yield in Heliodon
- Import the model - a .3dm, .obj or .dae file of the building or site. It is parsed locally in your browser and never uploaded.
- Set the site - pick the location on a map so the correct sun path, latitude and time zone are used.
- Define the array surface - isolate the roof, or the layer that will carry the modules.
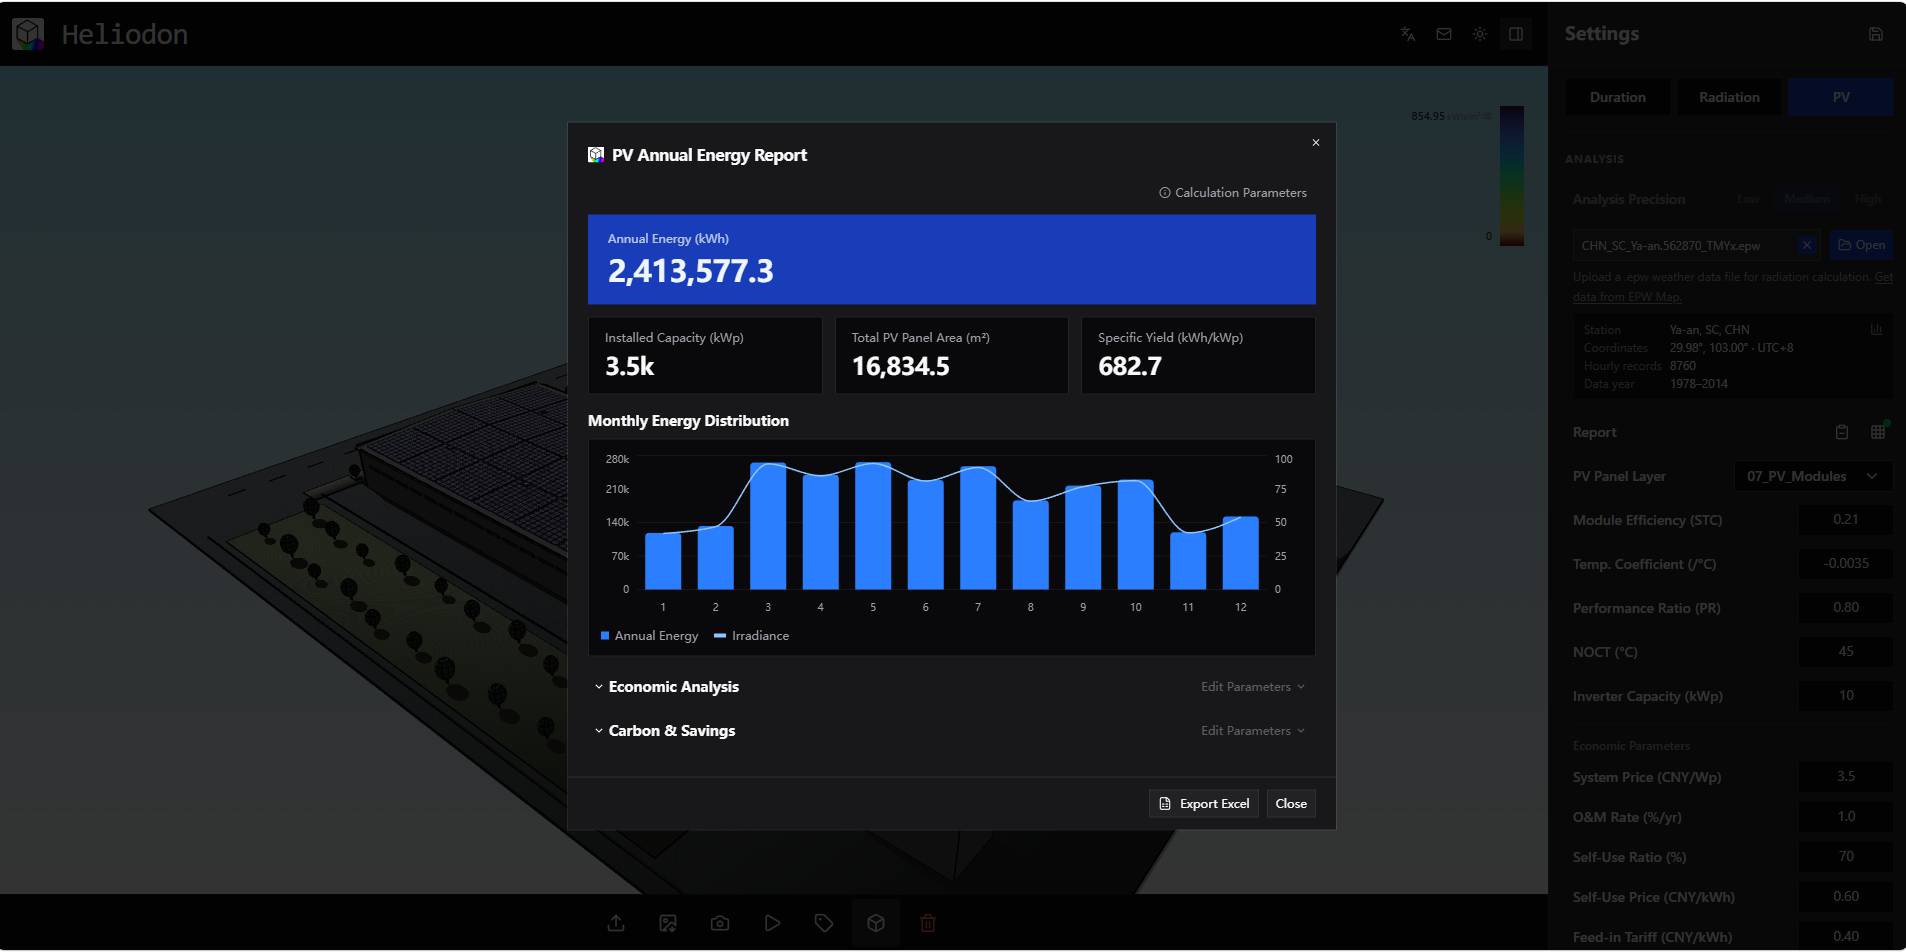
- Accumulate the year - integrate hourly radiation over the full year on that layer to estimate output, instead of applying a flat shade factor.
- Price the result - the same run feeds the economic analysis (NPV, ROI, LCOE and simple payback) and the carbon saving.
- Export - save a screenshot, record the animation, or download the Excel report.
Sanity checks before you trust a number
Four questions are worth asking of any yield figure, including one produced by this tool:
- Was plane-of-array irradiance used, or the horizontal value? At mid latitudes the gap between them can reach 15% on its own.
- Was shading computed hour by hour, or reduced to a single percentage?
- Is the performance ratio stated openly? A quote that will not name its PR is hiding something. 0.75 to 0.85 is a healthy fixed-tilt system; below 0.70 usually means a real problem or a very conservative design.
- Was temperature handled? Hot climates lose more to heat than to shade, and a calculation that ignores it will over-promise.
Answer those four and a PV yield estimate stops being a marketing number and becomes something you can defend.
Turn your model into a yield estimate
Heliodon is free and runs in your browser - no install, no account. Import a .3dm, .obj or .dae model, set the site on a map, and accumulate hourly radiation over the year to estimate PV output, then read the economics and carbon saving from the same run.
Launch HeliodonFrequently asked questions
What is the difference between PV yield and PV power?
Power (kW) is instantaneous, yield (kWh) is energy accumulated over time. A 5 kWp array is rated at 5 kilowatts, but only under standard test conditions; over a year it might deliver something closer to 5,000 kWh.
How do you calculate annual PV yield?
Multiply three numbers: the annual irradiance in the plane of the array (kWh/m2), the array's peak rating (kWp), and the performance ratio. A 1 kWp array at 1,600 kWh/m2 with a PR of 0.80 gives 1,280 kWh per year.
What is a realistic performance ratio?
For a well-designed, unshaded fixed-tilt system, 0.75 to 0.85 is normal. A figure below 0.70 usually points to shading, soiling or a badly matched inverter rather than a conservative estimate.
How much does shading reduce PV output?
Less than a full blackout but more than the shaded area suggests. Because modules are wired in series strings, shading one part of a module can cut a whole string segment through its bypass diodes. That is why shading has to be simulated hour by hour instead of averaged into a single percentage.
Do I need a full simulation, or is a database enough?
A flat, unobstructed field can be estimated from a climate database. A roof with parapets, chimneys, dormers or neighbouring buildings needs the real scene geometry and hourly sun positions - exactly what a 3D sun and shadow tool computes.